A/B Testing for Online Stores: When It Pays Off and How to Set It Up Right

What an A/B test is, how many visits it needs and what to do when your traffic is not enough. With a calculator for your store.

Jason Spizert

Jason Spizert

Updated on October 21, 2026

Published 5 min read
The short answer

An A/B test shows two groups of visitors two variants of the same page and measures which one sells more. It only pays off if your store has enough visits and purchases: at a 1% conversion rate, a test needs about 79,000 visits to reliably detect a 20% difference. If your traffic is not enough, a before-and-after comparison over fixed time periods is the better choice.

A/B tests are considered the standard of conversion optimization. That is true, with one condition people rarely say out loud: a test needs volume. Without enough purchases, it measures chance, and you decide on a number that would look different in the next test.

A/B test running0 visits
Variant A1,0 %
0
purchases · 1,0 %
Variant B1,2 %
0
purchases · 1,2 %
Confidence that B is better0%
Schwelle 95 %
Result is reliable, after about 79,000 visits.

What is an A/B test?

In an A/B test, also called a split test, a tool splits your visitors into two groups at random: A sees the current page, B a changed one. Both run at the same time under the same conditions. That is exactly what sets it apart from a before-and-after comparison:

Why an A/B test tells you more than a before-and-after
A/B testTwo groups, at the same timeSame ads, same week, same weather. Any difference comes from the change.
Before and afterOne month against the nextalso measures:SeasonCampaignsPricesWhatever else changed is baked into the result.
A/B test and split test usually mean the same thing. The testing tool assigns visitors to A and B at random.

Gut feeling vs. data

Almost every store has this discussion: “The new page looks so much better.” In the end, whoever is loudest or controls the most budget decides. Everyone is sure of their opinion, and nobody asks the customers.

What a test replaces

A clean A/B test replaces “I think” with “customers have shown us.” A badly calculated one replaces an opinion with chance, and that is more dangerous, because it looks like proof.

What statistical significance means

Significance answers one single question: how likely is it that a difference is just chance? The easiest way to see it is with a coin.

Chance or a real difference?
Coin, 10 flips7× headsHappens with a perfectly fair coin in 17% of cases. No reason to think it is rigged.
Coin, 1,000 flips700× headsSame ratio, but practically impossible with a fair coin. This is a real difference.
Your store, 1,000 visits each
A10 purchasesB14 purchases
“B is 40% better.” Even if both pages were equally good, a gap like this would happen in about 4 out of 10 tests purely by chance.

A result usually counts as significant if a gap like this would occur in fewer than 5 out of 100 cases when both variants are equally good. That is the 95% you see in testing tools. But significant does not mean important: a tiny difference can be significant and still not be worth it.

Jason Spizert
Jason SpizertBusiness psychologist (B.Sc.), founder of NextPercent
In a business psychology degree, statistics is mandatory. You learn early that a result only means something when three things are true: enough participants, a procedure fixed in advance and a difference that is bigger than chance.Psychology learned how much this matters the hard way. When researchers repeated one hundred published studies in 2015, only about a third of the results held up. Many of the originals were too small. The exact same thing happens in stores when a test is declared a winner after a few days.
Source: Open Science Collaboration, Science 2015

When an A/B test pays off

How many visits a test needs depends on your conversion rate and on the difference you want to detect. The smaller both are, the more visits you need. Calculate it for your store:

Is your traffic enough for a test?
Nothing is stored or sent.
visits
%
%
Visits needed
79,200
for both variants combined
Test duration
16 months
at your traffic
A classic A/B test hardly pays off here. Test bigger changes or work with a clean before-and-after comparison over fixed time periods.

Many stores sit in the low single-digit percentage range, and small changes like a new button color rarely move the result by more than a few percent. Big changes, such as a rebuilt product page, have a better chance of becoming visible:

The smaller the difference, the more visits you need: calculated at a 1.5% conversion rate
+5%The range of small changes like a button colorabout 840,000 visits, about 5 years for the small store
+10%about 210,000 visits, about 16 months for the small store
+20%about 52,500 visits, about 4 months for the small store
+40%about 13,100 visits, about 1 month for the small store
Lehr's rule of thumb (95% confidence, 80% power), as in the calculator above. “Small store”: €10,000 revenue a month at a €50 order value, so about 13,300 visits a month.

At what store size testing pays off

This leads to an uncomfortable truth: for small stores, conversion optimization through A/B tests does not pay off. Two stores, both with a €50 order value and a 1.5% conversion rate:

Store with €10,000 a month
Orders200
Visitsabout 13,300
Test goal+20%
Test durationabout 4 months
+€2,000 a month, after four months of waiting
Store with €200,000 a month
Orders4,000
Visitsabout 266,700
Test goal+10%
Test durationabout 3.5 weeks
+€20,000 a month, after just under a month

The small store waits four months for an extra €2,000 a month, and in that time season, advertising and product range all change. It gets more from a clear offer, more of the right visitors and fixing obvious breaks in the store. The big store knows after just under a month whether a change brings in €20,000 a month. For that store, testing is the fastest lever there is.

How to set up an A/B test correctly

Five rules for a test you can trust
01
HypothesisIf we change X, Y goes up, because Z.
02
One changeOtherwise you will not know what worked.
03
Goal metric firstPurchases or revenue per visit, not clicks.
04
Duration firstFull weeks. Do not stop because it looks good.
05
Write it downResult and learning, even without a winner.

The hypothesis is the most important part. It says what you change, what should happen and why. Where good hypotheses come from is covered in our other guides.

No hypothesis vs. a real hypothesis
No hypothesis“Let's just test a green button.”No expected result, no reason. Without a winner, nothing is left.
HypothesisIfshipping costs are already shown on the product page,thenfewer buyers will abandon at checkout,becausethe surprise at the end goes away.Says what you change, what should happen and why. You learn something even without a winner.

The most common mistakes

Most tests do not fail because of the tool, but because of one of these four points:

Four mistakes that make a test worthless
01Stopping too earlyEarly on, the result swings a lot. If you stop as soon as B is ahead, you often catch a random spike.Better Set the duration in advance and stick to it.
02The wrong goal metricMore clicks on the add-to-cart button are not a win if people do not buy more in the end.Better Measure purchases or revenue per visit.
03Blindly trusting the trackingIf Shopify, GA4 and the testing tool count differently, you do not know which result to believe.Better Clarify first why Shopify, Meta and GA4 count differently.
04Too many variantsEvery extra variant splits your traffic again. Four weeks of runtime quickly turn into eight.Better One change, two variants.

What if your traffic is not enough?

Then an A/B test is the wrong tool, and that is nothing to be ashamed of. The more honest path has three steps. How we approach it is described on our page about conversion optimization.

Not enough traffic for a test? The more honest path
Step 1Find the break pointThe chain from visit to product page, cart and purchase shows where buyers drop off.
Step 2See the reasonHeatmaps and session recordings show why they leave at that point.
Step 3Change deliberately, compare fixed periodsOne change, then fixed time periods against each other, with no promotions running at the same time.
Not a substitute for a clean test, but more honest than a test that only measures chance.

A/B testing tools

Which tool fits depends mainly on what you want to test and how cleanly it works with your tracking.

Well-known testing tools, no ranking
External testing toolsVWOAB TastyKameleoonVarify.ioRun on any site, not just Shopify.
Shopify appsShopliftIntelligemsTest pages, themes or prices directly in your store.
DiscontinuedGoogle OptimizeNo longer available since September 2023.
Examples only, with no rating and no affiliate links. More important than the tool: tracking, duration and goal metric are fixed in advance.

We record every test in our own CRO cockpit: hypothesis, duration, result and what we learn from it. That way, even a test without a winner is not wasted.
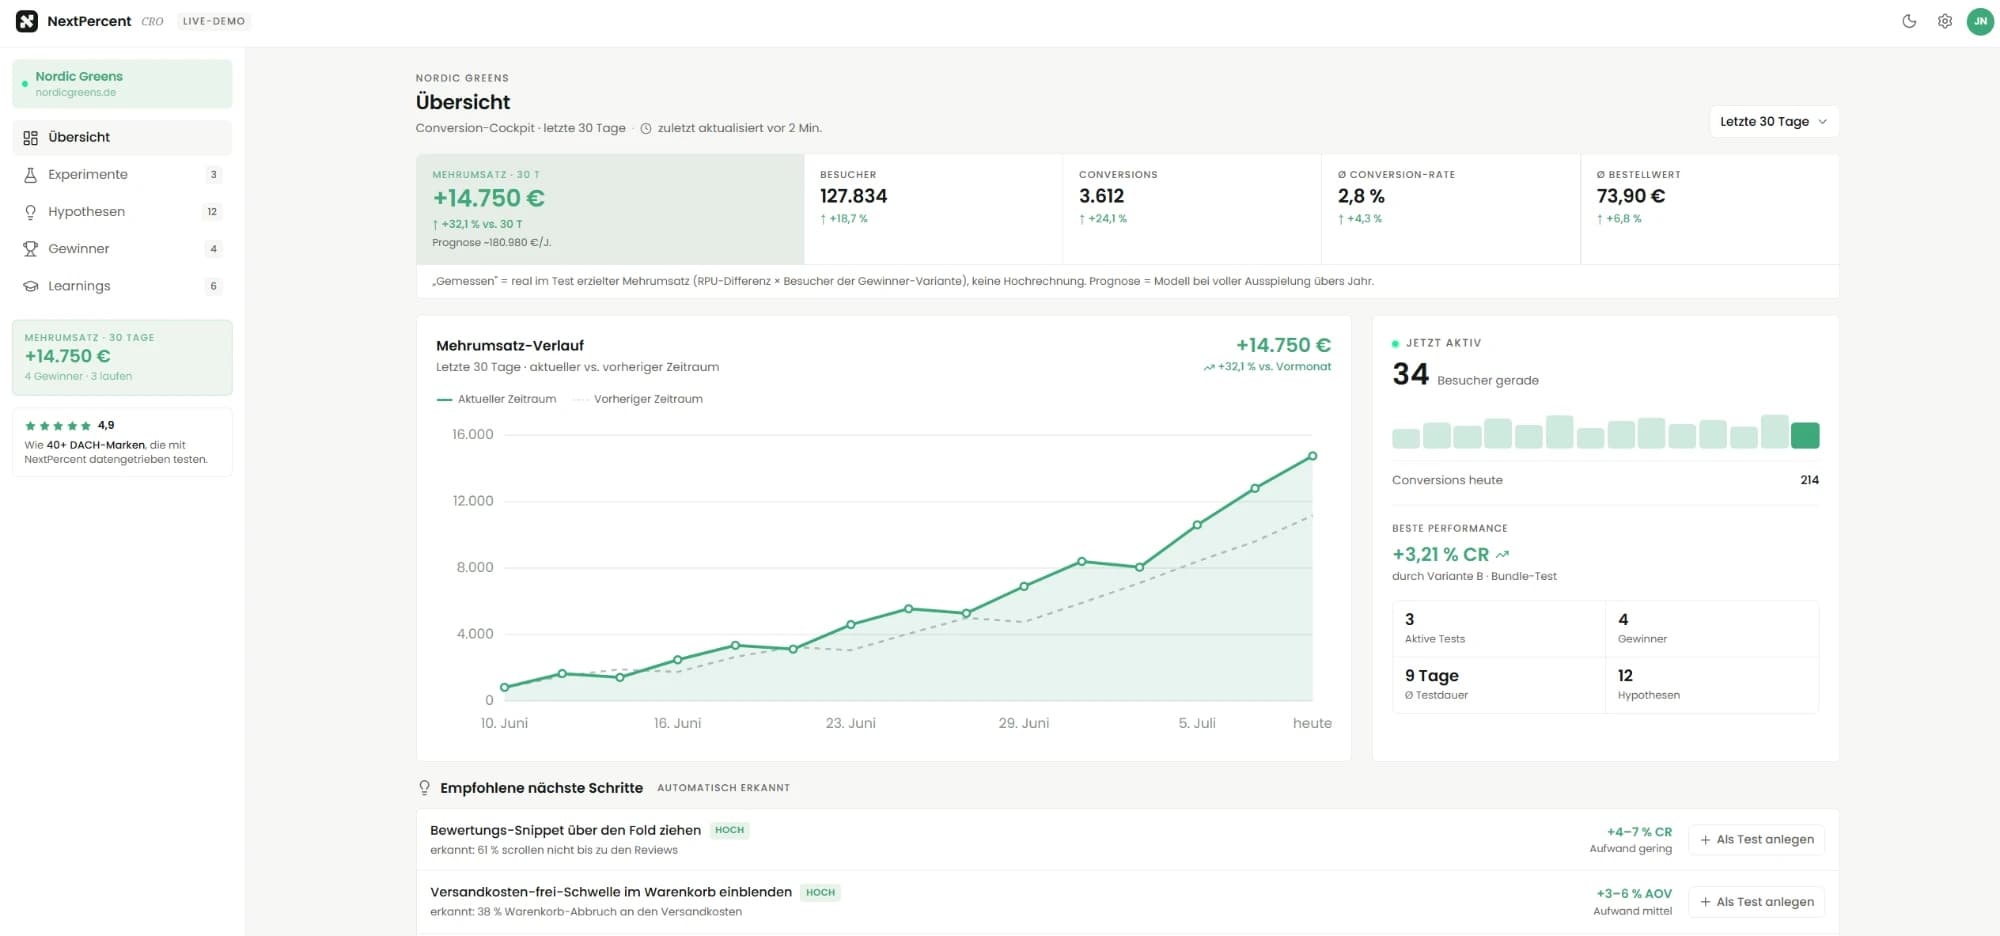
NextPercent's CRO cockpit with experiments, winners, hypotheses and learnings

Frequently asked questions

In an A/B test, randomly selected visitors see two variants of the same page: A is the current one, B the changed one. You measure which variant brings more purchases or revenue. Because both groups run at the same time under the same conditions, the difference can be traced back to the change.

Until the number of visits you calculated in advance is reached, and for at least two full weeks so every weekday is included twice. If you stop as soon as one variant is ahead, you often get a result that does not hold up later.

It depends on your conversion rate and on the difference you want to detect. At a 1% conversion rate, a test needs about 79,000 visits to reliably detect a 20% difference. The calculator in this article shows the number for your store.

It depends on visits and orders, not on revenue alone. As a rough guide: a store with €10,000 in monthly revenue and a €50 order value needs about four months to reliably detect a 20% improvement. A store with €200,000 detects 10% in just under a month. Below that, your offer, your traffic and obvious breaks in the store do more than tests.

It describes how unlikely it is that the measured difference is just chance. 95% is the usual threshold. But significance says nothing about whether the difference is big enough to pay off commercially.

A/B test and split test usually mean the same thing: two variants against each other. A multivariate test tests several elements at once in combinations. It needs far more traffic and does not pay off for most stores.

Yes, with apps or external testing tools. Which one fits depends on what you want to test: page content, themes or prices. More important than the tool is that tracking, duration and goal metric are fixed in advance.
See all insights

  • Reply within 24 hours
  • No obligation, no sales pitch

Request an intro call

How can we help?*
What budget do you have in mind?*

By submitting, you agree to the processing of your data as described in our privacy policy.

Rather pick a time directly?

Book a call directly
Patricia from the NextPercent team working on a laptop in an armchair

Jennifer Rosbach

Beauty brand (nagelati.de)

“As a young brand, it mattered to us to work with a partner who doesn't just execute, but really understands how ecommerce brands grow. That's exactly what we found. Clear communication, honest assessments and a good feel for conversion and brand presence.”