ROAS: Meaning, Formula and What a Good ROAS Is
ROAS is ad revenue divided by ad spend. Here is how to calculate it, at what value your ads make money, and why the same ROAS means profit for one store and a loss for another.

Jason Spizert
Updated on October 25, 2026
Published 12 min read
The short answer
ROAS (return on ad spend) measures how much revenue one euro of advertising brings in. The formula is revenue from ads ÷ ad spend: €8,000 in revenue from €2,000 in ad costs gives you a ROAS of 4, or 400 percent as a percentage. Unlike ROI, ROAS counts revenue instead of profit, so it is only good above your break-even point, which is 1 ÷ contribution margin, so 2.0 at a 50 percent margin.
Plug in your own numbers. The calculator shows your ROAS, your break-even point and what is left after the ads. Contribution margin is explained in chapter 3.
Run it with your numbers
Nothing is stored or sent.
Selling price minus product cost, shipping, payment fees and returns, divided by the selling price. Not the markup from your pricing sheet.
ROAS
4.00
Revenue per euro of ad spend.
Break-even ROAS
2.22
From here on, your ads cover their own cost.
POAS
1.80
Contribution margin per euro of ad spend. Below 1.00 you lose money.
Result after ads
€2,000
Contribution margin minus ad spend. Fixed costs are not included.
Your ads pay for themselves. At a 45 percent margin, your break-even is a ROAS of 2.22, and you reached 4.00. After ad spend, €2,000 of contribution margin is left, which still has to pay for rent, staff and tools.
What is ROAS?
ROAS stands for return on ad spend. The metric measures how much revenue one euro of ad budget brought back. Google Ads and Meta show it directly in the ad account.
- Revenue from ads
- EUR 8,000
- Ad spend
- EUR 2,000
ROAS = 8,000 / 2,000 = 4.0 (equals 400%)
ROAS as a factor and as a percentage
A ROAS of 4.0 means four euros of revenue per euro spent on ads. The same number sometimes appears as 4:1, sometimes as 400 percent. The math behind it is identical.
A ROAS of 1.0, or 100 percent, is not break-even. Your margin decides where break-even is: 1 divided by your contribution margin.
The difference between ROAS and ROI
ROAS works with revenue, ROI with profit. An example with the same numbers:
- Revenue from ads
- EUR 10,000
- Ad spend
- EUR 2,500
- ROAS
- 4.0
- Contribution margin at 45%
- EUR 4,500
- Left after ads
- EUR 2,000
Campaign ROI = 2,000 / 2,500 = 80%, fixed costs not yet paid
A ROAS of 4.0 sounds like four times your investment. What is left is €2,000, and rent, salaries and tools still have to come out of that. That is why every ROAS needs the margin question next to it.
How to calculate ROAS, step by step
Revenue from ads divided by ad spend for the same period. For the result to mean anything, it takes four steps.
- 1Period and levelAccount, campaign or ad set. Revenue and costs from the same period.
- 2Ad spendOnly the spend in the ad account. Agency and production costs belong in ROI.
- 3Attributed revenueNote who attributes it (Meta, Google, an analytics tool) and whether it includes VAT.
- 4DivideRevenue divided by cost gives you the factor, times 100 the percentage.
With several campaigns: add up revenue and costs first, then divide. The average of the individual values is off as soon as budgets differ in size.
- Attributed revenue in September
- EUR 5,000
- Ad spend in September
- EUR 1,000
ROAS = 5,000 / 1,000 = 5.0 (equals 500%)
Several campaigns: add first, then divide
- Campaign A: EUR 12,000 revenue on EUR 3,000 spend
- ROAS 4.0
- Campaign B: EUR 1,000 revenue on EUR 1,000 spend
- ROAS 1.0
- Average of the individual values (wrong)
- 2.5
- Total revenue / total spend
- 13,000 / 4,000
Overall ROAS = 3.25
The average clearly underestimates the account, because campaign A has three times the budget.
Calculate ROAS in Excel or Google Sheets
If revenue is in column B and ad spend in column C, the formula in column D is =B2/C2. For ROAS as a percentage, use =B2/C2*100 or format the cell as a percentage. For several campaigns, sum both columns first and then divide: =SUM(B2:B10)/SUM(C2:C10). German versions of Excel use SUMME instead of SUM.
What is a good ROAS?
Any ROAS above your break-even ROAS is good: 1 divided by your contribution margin. At a 50 percent margin, break-even is 2.0, at 25 percent it is 4.0. A ROAS of 3.2 is solid in the first case and a losing deal in the second.
Step 1: determine your contribution margin
Take a typical sale and subtract everything that arises from exactly this sale. What is left is your contribution margin. This is not the markup from your pricing sheet, which is usually much higher.
- Net selling price
- EUR 100.00
- Product cost
- EUR 35.00
- Shipping and packaging
- EUR 7.00
- Payment fees
- EUR 2.00
- Returns share
- EUR 6.00
Contribution margin = EUR 50.00, margin = 50%
Step 2: calculate your break-even point
Break-even ROAS = 1 ÷ contribution margin, in the example 1 ÷ 0.5 = 2.0. Every euro of ad spend has to bring in at least two euros of revenue for your ads to cover their own cost.
Break-even ROAS by contribution margin
How far your ads have to go before they cover their own cost. Calculated as 1 divided by the margin.
- 50% marginfrom ROAS 2.00
- 40% marginfrom ROAS 2.50
- 30% marginfrom ROAS 3.33
- 25% marginfrom ROAS 4.00
- 20% marginfrom ROAS 5.00
A ROAS of 3.0 is a good result at a 50 percent margin and a losing deal at 25 percent. Same number, two opposite decisions.
And the industry benchmarks you find online?
They help less than they promise. One of the largest data sets is published by Triple Whale, an analytics tool for online merchants: from August 2025 to July 2026, the median ROAS was 1.88 on Meta and 3.27 on Google Ads.
| Industry | Meta | Google Ads |
|---|---|---|
| All industries | 1.88 | 3.27 |
| Apparel and accessories | 2.24 | 3.99 |
| Home and garden | 2.25 | 3.48 |
| Food and beverage | 1.61 | 3.18 |
| Beauty | 1.54 | 2.81 |
| Health and wellness | 1.44 | 2.06 |
Source: Triple Whale, benchmark reports for Meta (over 40,000 brands) and Google Ads (over 21,000 brands), published in August 2026, retrieved October 21, 2026. Not broken down by country.
Three reasons not to derive a target from these numbers. The median does not know your margin: 1.88 is below break-even at a 50 percent margin and above it at 60 percent. The channel alone varies a lot, because on Google someone is searching, while on Meta they are interrupted while scrolling. And every measurement counts by its own rules. What a purchase through Meta actually costs is covered in our article on the cost of Meta ads.
The only benchmark that applies to your store is your own break-even point. You can calculate it in a minute.
Two limitations
Break-even ROAS only covers variable costs, not rent, staff and tools. And it only counts the first purchase. If customers come back, you can acquire them below break-even. How far below depends on customer lifetime value. If you are just starting your brand, plan your ad budget as a line item from day one, not as whatever is left.
Why is ROAS alone misleading?
Because the number hides five things, and each one is enough to turn a budget decision in the wrong direction.
1. Revenue is not contribution margin
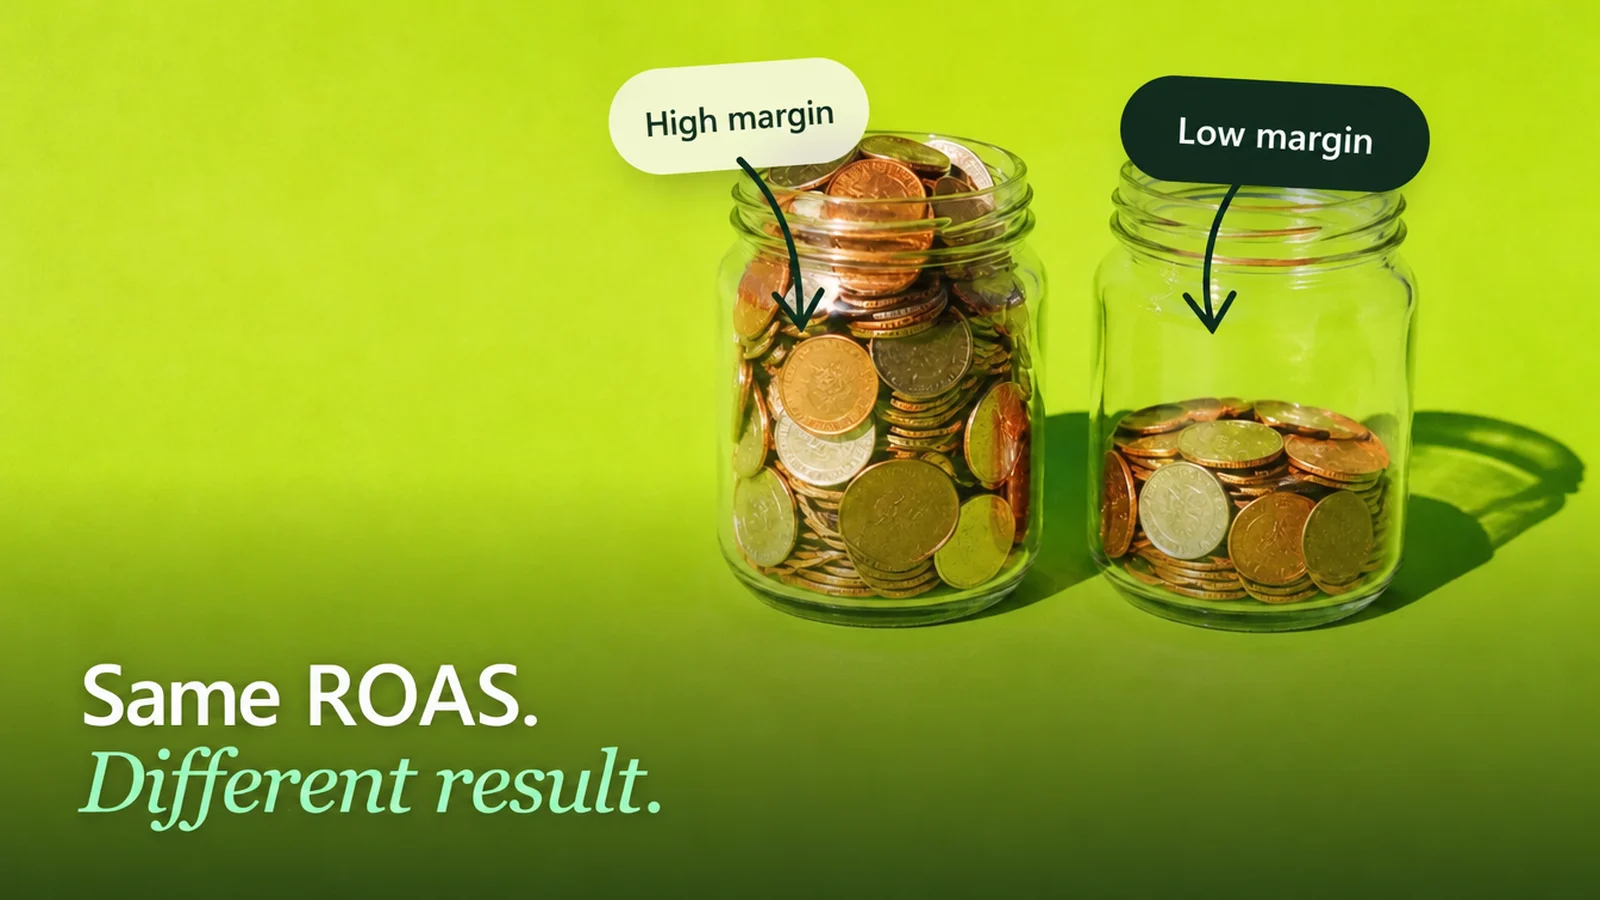
A store with a 20 percent margin and one with 60 percent can report the same ROAS and live in different worlds financially. The fix is called POAS, profit on ad spend: contribution margin divided by ad spend. In example 1, a ROAS of 4.0 becomes a POAS of 1.8.
2. Platform ROAS vs. blended ROAS
Meta and Google each count the revenue they attribute to themselves. Both see the same customer, and both claim them.
One month, two channels, two truths
Each platform reports a ROAS of 4.0. Calculated across all channels, it is 3.0.
What the platforms report
€20,000


What actually arrived in the store
€15,000

The hatched area is €5,000 that never existed. Both systems claimed the same purchases. Add up the platform numbers and you make yourself richer by exactly that amount.
Blended ROAS, often called MER, divides total store revenue by all ad spend and cannot count anything twice. In return, it does not tell you which channel contributed what. The blended value steers the total budget, the platform value steers the split.
3. Every platform counts differently

Never compare ROAS values across systems. Decide within one system over time, and set the total budget with the blended value.
How the numbers differ and when your tracking is really broken is explained in this article on Shopify, Meta and GA4.
4. New and returning customers in the same bucket
Brand searches and retargeting reliably deliver good values, because the buying decision was often made long before. An account whose overall value comes from existing customers is not growing, it is harvesting. So roughly separate revenue from new and from returning customers. What a new customer may cost belongs in your view of customer acquisition cost.
5. Incrementality
How much revenue would have happened without the ads? ROAS only counts what did happen. The simplest approximation: pause a campaign for two to four weeks and watch total revenue. If it stays almost the same, the reported ROAS was mostly attribution.
ROAS is a good thermometer and a bad goal. It reliably shows that something has changed. Whether the change pays off is in other numbers.
ROAS, MER, POAS and ROI: what measures what?
All four divide a result by an input. They differ in which result and which input.
| Metric | Calculation | Answers |
|---|---|---|
| ROAS | Ad revenue / ad spend | How much revenue per euro of ad spend |
| Blended ROAS / MER | Total revenue / total ad spend | Does marketing pay off overall |
| POAS | Contribution margin / ad spend | Is money left after the ads |
| ROI | Profit / total investment | Does the investment pay off overall |
For day-to-day steering, two are enough: the blended value for the total budget and POAS for the question of whether anything is left. Platform ROAS stays useful for allocating spend within a channel, not as a measure of success.
When does target ROAS pay off as a bid strategy?
Only once you have enough data. With target ROAS, you give the metric as an instruction, in Google Ads as a percentage: the system bids higher where it expects a valuable purchase and holds back otherwise. The most common mistake is a target right at or above break-even.
Who none of this applies to: if you only get a few orders a month from ads, you need neither target ROAS nor POAS. At that volume, every value is mostly chance, and the better question is whether the page behind the ad sells. If you would rather not run the campaigns yourself, see how we work as a Google Ads agency and as a Meta ads agency.
How do you improve your ROAS?
Through the numerator or the denominator. Both work, but the market sets click prices, while you control the path to purchase.
You can find where the buying process breaks with these four questions, and the article on a good conversion rate tells you whether your rate is unusual at all. Whether a change really lifts the rate is shown by a properly set up A/B test, and email flows after the first purchase take care of repeat purchases. If you want a second pair of eyes from outside, our conversion optimization is the shortest path.
If you know your store gets traffic but not where exactly it loses revenue, the sensible next step is not another tactic. It is a structured diagnosis.
That is exactly what our store audit does: we work through the order of checks from this guide with your real data. Step 1 is validating the tracking, because otherwise every further analysis stands on the wrong foundation.
- 01Check data and tracking
- 02Locate the break point
- 03Clearly prioritized results with a next test
- Google Ads Help: "Target ROAS" bid strategy (minimum volumes, value in percent), retrieved October 21, 2026
- Triple Whale: Facebook Ad Benchmarks by Industry (Updated 2026 Data), August 17, 2026, over 40,000 brands, period August 1, 2025 to July 31, 2026, retrieved October 21, 2026
- Triple Whale: Google Ads Benchmarks by Industry (Updated 2026 Data), August 20, 2026, over 21,000 brands, period August 1, 2025 to July 31, 2026, retrieved October 21, 2026