How to Calculate Customer Lifetime Value: What a Customer Is Really Worth to Your Store
Calculate customer lifetime value: three formulas, a worked example and a calculator. And why the first order does not decide what a new customer may cost.

Jason Spizert
Updated on October 21, 2026
Published 6 min read

The short answer
Customer lifetime value (CLV) is the contribution margin a customer brings to your store over a fixed period. For ad decisions, calculate over 12 months: average order value times orders per customer times contribution margin. With an €80 order value, 1.6 orders a year and a 40 percent margin, that comes to €51.20. That is also the upper limit for what a new customer can cost you.
What is customer lifetime value?
Customer lifetime value, CLV or LTV for short, is the value of a customer over the time they buy from you. In practice, you set a period, usually 12 months.
What matters is which value you mean. Many tools calculate with revenue, Shopify and Klaviyo included. For the question of how much advertising a customer can carry, only contribution margin counts: what is left after product cost, shipping, payment fees and returns.
Why is the first order the wrong yardstick?
Because it only shows part of the customer. In the growth phase, most stores steer by the ROAS of the first order: a customer is profitable if their first order paid for the ads.
That rule has two flaws. It usually measures revenue instead of contribution margin: at a 40 percent margin, a ROAS of 2 means only 80 cents come back per ad euro. And it ignores everything after the first purchase.
"Not for the next ad set. But for what happens after the first purchase."Founder of two D2C brands, LinkedIn (translated from German)
An example. Kanto sells e-bike accessories, including wear parts like brake pads and chains. A new customer costs €40 via Meta (how a price like that comes about is explained in How much do Instagram and Facebook ads cost?). The first order is €80 net, the ROAS is 2.0, the break-even point 2.5. By the first-order rule, Kanto loses €8 per new customer.
But 100 first-time customers place 160 orders in their first year. So each customer brings in €51.20 in contribution margin, and after subtracting the ads, €11.20 is left.
The third line is the dangerous one: €128 against €40 makes almost any campaign look good. When the money is really back is shown by the curve:
What the first order decides
Not whether the customer pays off. Only how long you wait for your money. At Kanto, the new customer is paid back in the fourth month.
How do you calculate customer lifetime value?
With one of three formulas, from rough to precise. Simple, on revenue: order value times orders per year times years, €128 for Kanto. Good for an overview, useless for budget questions. On contribution margin: the same calculation times margin. This is what you use to decide what a new customer can cost.
From cohorts: take all first-time customers of one month and count their orders over the following 12 months. That is more precise than an average across all customers, which loyal regulars skew.
"On top of that, the repurchase rate after the 2nd order is in the range of 65-70%."Founder of a cosmetics brand, LinkedIn (translated from German)
Your number may be completely different, which is why you look at your own cohorts. The textbook formula with a churn rate comes from subscription businesses. In a store, nobody cancels; customers simply stop buying.
| Variant | Calculation | Kanto | Good for |
|---|---|---|---|
| Simple, revenue | Order value × orders per year × years | €128 | Overview |
| Contribution margin | Revenue CLV × contribution margin | €51.20 | Ad budget, maximum CAC |
| Cohort | Orders per first-time customer after 12 months × margin per order | €51.20 | Realistic planning, needs 12 months of data |
| With churn rate | Annual margin / churn rate | not meaningful | Subscription models with cancellation |
How much can a new customer cost?
At most as much as they bring you in contribution margin over 12 months. For that, you need CAC (customer acquisition cost): advertising and acquisition costs divided by the number of new customers in the same period. Kanto: €4,000 in ads, 100 new customers, CAC €40. Divide by new customers, not by all orders, otherwise the number looks cheaper.
"We pay €65 for a new customer via Meta ads. The bra costs €14 to make. We have known that for a long time. And we still dutifully pay every month, because: what is the alternative?"Founder of a D2C brand, LinkedIn (translated from German)
Whether €65 is too much only becomes clear in relation to CLV. The common rule of thumb is 3 : 1. It comes from the software industry, and David Skok explicitly calls it a guideline. When it is transferred to stores, what it is calculated on usually gets lost:
The hard upper limit for CAC is CLV on contribution margin, €51.20 for Kanto. At that point you earn nothing on the customer, and rent, team and tools are still unpaid. How much buffer you need depends on fixed costs and cash flow. Run it with your numbers:
For your ad account, work backwards: €80 order value divided by €51.20 maximum CAC gives you a new-customer ROAS of 1.56. Below that, the customer does not pay off even over 12 months. The break-even point for the first purchase is explained in ROAS: formula and break-even point; why Meta, Google and Shopify show different numbers is covered in the article on Shopify, GA4 and Meta. If you want the budget managed accordingly, see our approach to performance marketing.
Where do you find the numbers in Shopify and Klaviyo?
The repurchase data is already in your store. Shopify's "Customer cohort analysis" report groups customers by the month of their first order. As the metric, you choose, for example, customer count, retention rate, revenue or amount spent per customer.
With "Show predictions", Shopify estimates future spending per cohort. The option only appears with the "Amount spent per customer" metric, according to Shopify needs 24 months of data, and according to Shopify is no guarantee.
 When Klaviyo starts predicting CLV
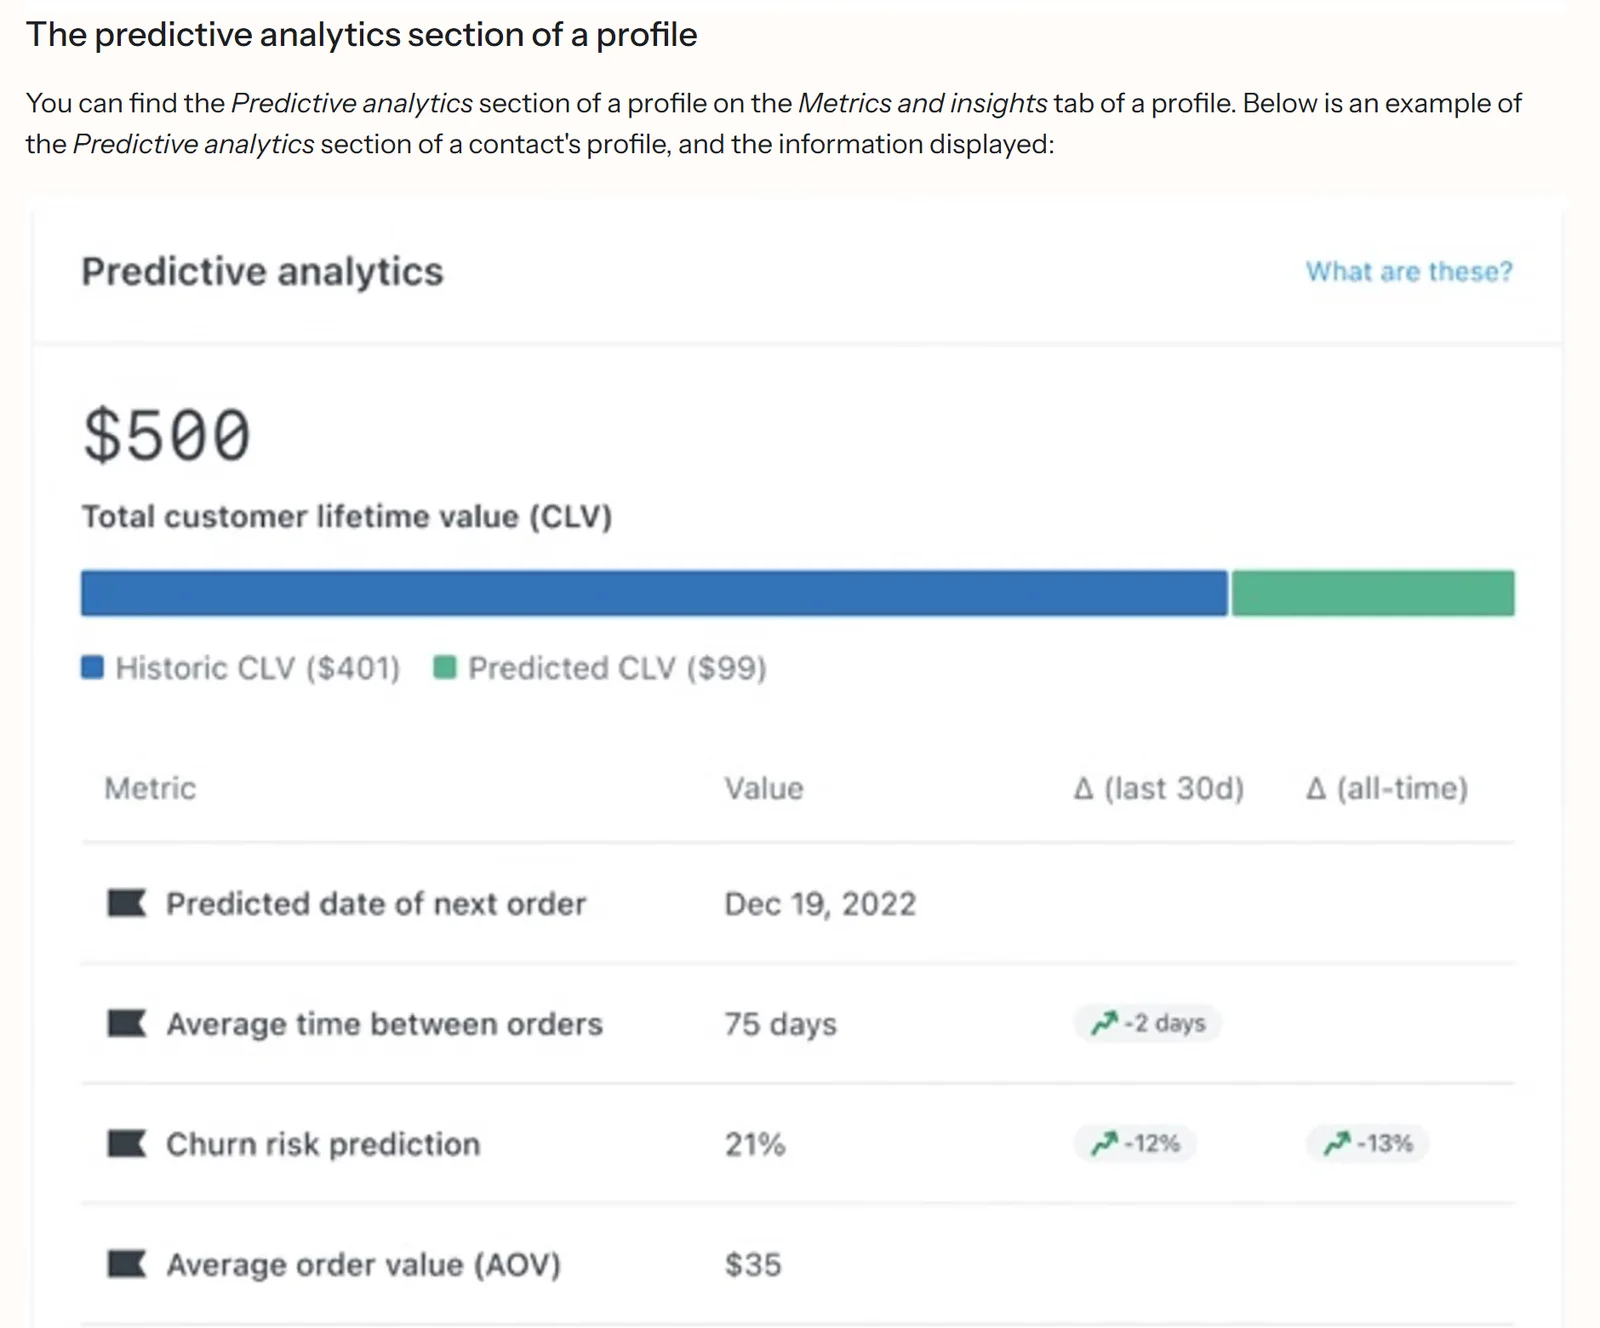
Customers with a high predicted value get different emails than occasional buyers. What that looks like is on our Shopify email marketing page.

When does this calculation not hold up?
When there are no repeat purchases you can build on.
The calculation holds if …
- customers can buy again: wear parts, refills, care products.
- you have at least one complete 12-month cohort.
- you can pre-finance a new customer for a few months.
- repeat purchases come without a coupon.
Be more cautious if …
- people buy it once: an e-bike, a mattress, a wedding ring. Then the first order has to carry the customer.
- your store is less than a year old. Work with the repeat purchases you have seen, not the ones you hope for.
- your cash is tight. At Kanto, every 1,000 new customers a month tie up €8,000 for about four months.
- the second order only comes with a 20 percent discount. Calculate with the margin after the discount.
If you are just building your brand, plan the ad budget in from the start: Start your own brand.
How do you increase customer lifetime value?
Through one of the three factors in the formula: order value, orders per customer or margin. With a replenishment range, the biggest lever is usually the second order.

Before that, it is worth looking one step earlier: do enough visitors buy a first time at all? Whether your rate is unusual is covered in the article on a good Shopify conversion rate; where your store loses revenue is what our conversion optimization finds out.
Key takeaway
A customer is profitable when their contribution margin over 12 months is higher than what they cost. Not only once their first order has paid for the ads.
Frequently asked questions
Customer lifetime value (CLV, also LTV) is the value a customer brings to your store over time. For ad decisions, calculate it as contribution margin over 12 months, not as revenue over the entire customer relationship.
Average order value times orders per customer per year times years gives you CLV on a revenue basis. Multiply that by your contribution margin and you get the CLV you can plan ad budgets with. Example: €80 times 1.6 times 40 percent equals €51.20.
None. Customer lifetime value (CLV) and lifetime value (LTV) are the same metric. What matters more is whether it is calculated on revenue or on contribution margin.
Divide your advertising and acquisition costs for a period by the number of new customers in the same period. €4,000 in ads and 100 new customers give you a CAC of €40. Count only new customers, otherwise the number looks cheaper than it is.
The common rule of thumb is 3 : 1. It comes from the software industry and is a guideline, not a study. For a store, calculate the ratio on contribution margin. Above 1 you make money on the customer; how much buffer you need beyond that depends on fixed costs and cash flow.
For ad decisions, over 12 months. Longer periods assume customers buy just as often year after year, and they rarely do. On top of that, you have to front the money for the customer today.
In the "Customer cohort analysis" report under Analytics, Reports, category Customers. It groups customers by the month of their first order and shows retention rate, revenue and amount spent per customer. Shopify shows revenue; you apply the margin yourself.
According to Klaviyo, from at least 500 customers with an order, 180 days of order history with orders in the last 30 days, and some customers with three or more orders. Until then, the section in the profile stays empty.